
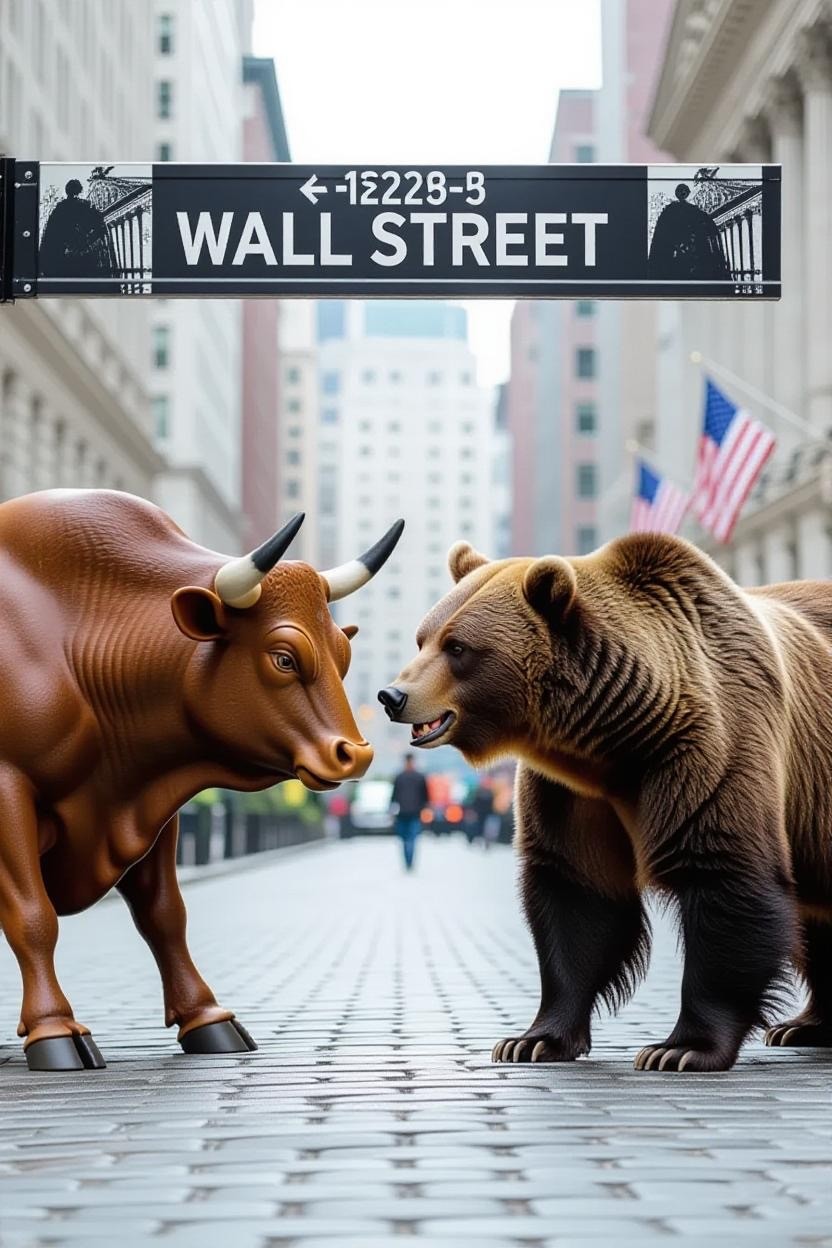
July 2026 was characterized by heightened intra-month volatility across U.S. and global financial markets. Equity markets navigated a complex backdrop marked by artificial intelligence sector valuation adjustments, fluctuating crude oil prices driven by geopolitical conflicts in the Middle East, and sticky yield pressures.
Despite broad-based headwind pressures mid-month, major equity benchmarks closed July on a strong upward trajectory. The S&P 500 climbed over 2% during its final two trading sessions to finish virtually flat (-0.06%). A key contributor to this late-month turnaround was Microsoft, which gained nearly $450 billion in market value in a single trading session on July 30, 2026. Shares surged 15% to 16%—marking Microsoft’s strongest single-day percentage increase since October 2008 and establishing a record for the largest single-day market cap increase in stock market history.
| Index | 1 Month % | YTD % | 1 Year % |
| S&P 500 Total Return | -0.06 | 10.14 | 19.56 |
| NASDAQ Composite** | -3.20 | 9.17 | 22.88 |
| S&P Developed Ex-US BMI* | -1.30 | 12.8 | 27.59 |
| Dow Jones Commodity (DJCI) | 7.94 | 26.28 | 35.40 |
| S&P US Aggregate Bond* | -0.93 | -0.09 | 3.13 |
Equity Market Dynamics & Sector Analysis
Market participation broadened notably throughout July. For the second consecutive month, the S&P 500 Equal Weight Index (+1.01%) outpaced the market-cap weighted S&P 500 (-0.06%), reflecting a ongoing rotation away from top-heavy market concentration. Mega-cap and smaller-cap equities lagged core large-caps, with the S&P 500 Top 50 declining -0.82%, while the S&P MidCap 400 (-2.38%) and S&P SmallCap 600 (-1.90%) posted moderate losses.
- Energy: Led all sector groups with a 12.60% surge in July (+34.74% YTD), propelled by rising crude oil prices and global supply disruptions.
- Financials: Ranked as the second-best performer, gaining 6.16%.
- Information Technology & Industrials: Remained the weakest sectors for the month, dropping -3.43% and -3.01% respectively, driven by a broad selloff across the AI supply chain—from hardware semiconductors to mega-cap hyperscalers. Despite July’s pullback, both sectors maintain robust double-digit gains year-to-date.
Factor performance highlighted a distinct pivot toward defense and value. The S&P 500 Enhanced Value (+5.18%), Low Volatility High Dividend (+3.35%), and Value (+2.01%) indices led factor categories. Conversely, prior high-flying leadership factors suffered severe retrenchments, with Momentum down -11.04% and High Beta down -10.13%.
Institutional Spotlight: Leopold Aschenbrenner & “Situational Awareness”
Leopold Aschenbrenner, a former OpenAI superalignment researcher, rose to prominence following his widely read 2024 research series titled “Situational Awareness,” which outlined a high-conviction macro framework regarding rapid AGI timelines, multi-trillion-dollar artificial intelligence capital expenditures, and national security imperatives. His hedge fund, Situational Awareness, was established to trade against these multi-year thematic shifts in compute bottlenecks, energy supply constraints, and power grid demand.
The July Unwind & Market Contagion
In July 2026, that vulnerability triggered a crisis when core long holdings across semiconductors and data center infrastructure suffered sharp drawdowns, while short software positions rallied against the book. The resulting 67% portfolio loss sparked rolling margin calls, forcing Aschenbrenner into a distressed fire sale where the bulk of the fund’s $16 billion public equity book was transferred to Ken Griffin’s Citadel. This forced liquidation sent shockwaves across the stock market: heavy institutional unwinding depressed AI hardware and utility valuations, while forced short-covering triggered an aggressive squeeze in software stocks, compounding a broader retreat across global tech-focused hedge funds.
Fixed Income & Federal Reserve Outlook
Fixed income markets experienced downward pressure in July, with the S&P U.S. Aggregate Bond Index falling -0.93%.
Selected Fixed Income Yields & Returns
————————————————————————-
Asset Class Yield 1M Return
————————————————————————-
S&P U.S. Aggregate Bond 4.89% -0.93%
iBoxx $ Treasuries 6.59% -0.95%
iBoxx $ Liquid Investment Grade 5.98% -2.31%
iBoxx $ Liquid High Yield 7.49% -0.30%
————————————————————————-
Data Source: S&P Dow Jones Indices LLC (as of July 30, 2026).
- Monetary Policy: The Federal Reserve left the Federal Funds Rate unchanged during its July meeting, aligning with broader market expectations despite a 30% consensus pricing in a potential rate hike.
- Leadership & Structure: New Federal Reserve Chairman Kevin Warsh signaled an intent to pivot policy toward market-driven rate mechanics. Additionally, internal discussions have emerged regarding a potential reduction of formal FOMC meetings from eight to four per calendar year.
- Yield Curve Pressure: Concerns over inflation persistence and a hawkish Fed policy path pushed long-term yields upward, driving the 30-year Treasury yield to its highest point since 2007.
Commodities & Alternatives
The commodity complex posted broad-based gains throughout July. The Dow Jones Commodity Index (DJCI) rose 7.94%, extending its year-to-date performance to 26.28%.
- Energy Commodities: The S&P GSCI Energy Index surged 22.46% on the month due to heightened geopolitical friction in the Middle East and structural power requirements.
- Agriculture & Metals: Agriculture posted solid advances (+8.88%), while industrial metals (+3.60%) and precious metals (+0.16%) saw modest gains.
Source: S&P Dow Jones Indices LLC and/or its affiliates. Data as of July 31, 2026, except * as of July 30, 2026. Index performance based on total return (USD). Past performance is no guarantee of future results.
**NASDAQ Data as of July 31, 2026 Overview for COMP
Investment advice offered through Stratos Wealth Advisors, LLC, a registered investment advisor. Stratos Wealth Advisors and Synergy Wealth Management are separate entities.